← Back to news
Product News & Updates
Introducing the Building Intelligence Center
Meet the Building Intelligence Center (BIC), the Next Sense platform for building performance: one picture of energy, comfort and occupancy, a Building Agent you can ask anything, and savings verified with real meter data.


We're introducing the Building Intelligence Center, or the BIC: the Next Sense platform for building performance. It brings everything we know about a building together in one place, helps you understand it, and tracks every improvement until the savings are confirmed.
In this post, we'll show you what the BIC does. We'll look at how it gives you one picture of building performance, how you can get answers from your data, and how a finding becomes a verified saving. At the end, we'll share what we're working on next. If you'd rather see it live, you can book a demo at any time.
One picture of building performance
The BIC brings a building's energy, comfort and occupancy data together, down to the room and the hour, for a single building or a whole portfolio. These three belong together. A drop in energy use is good news, but only if the rooms are still comfortable, and a rise might simply mean more people are in the building.
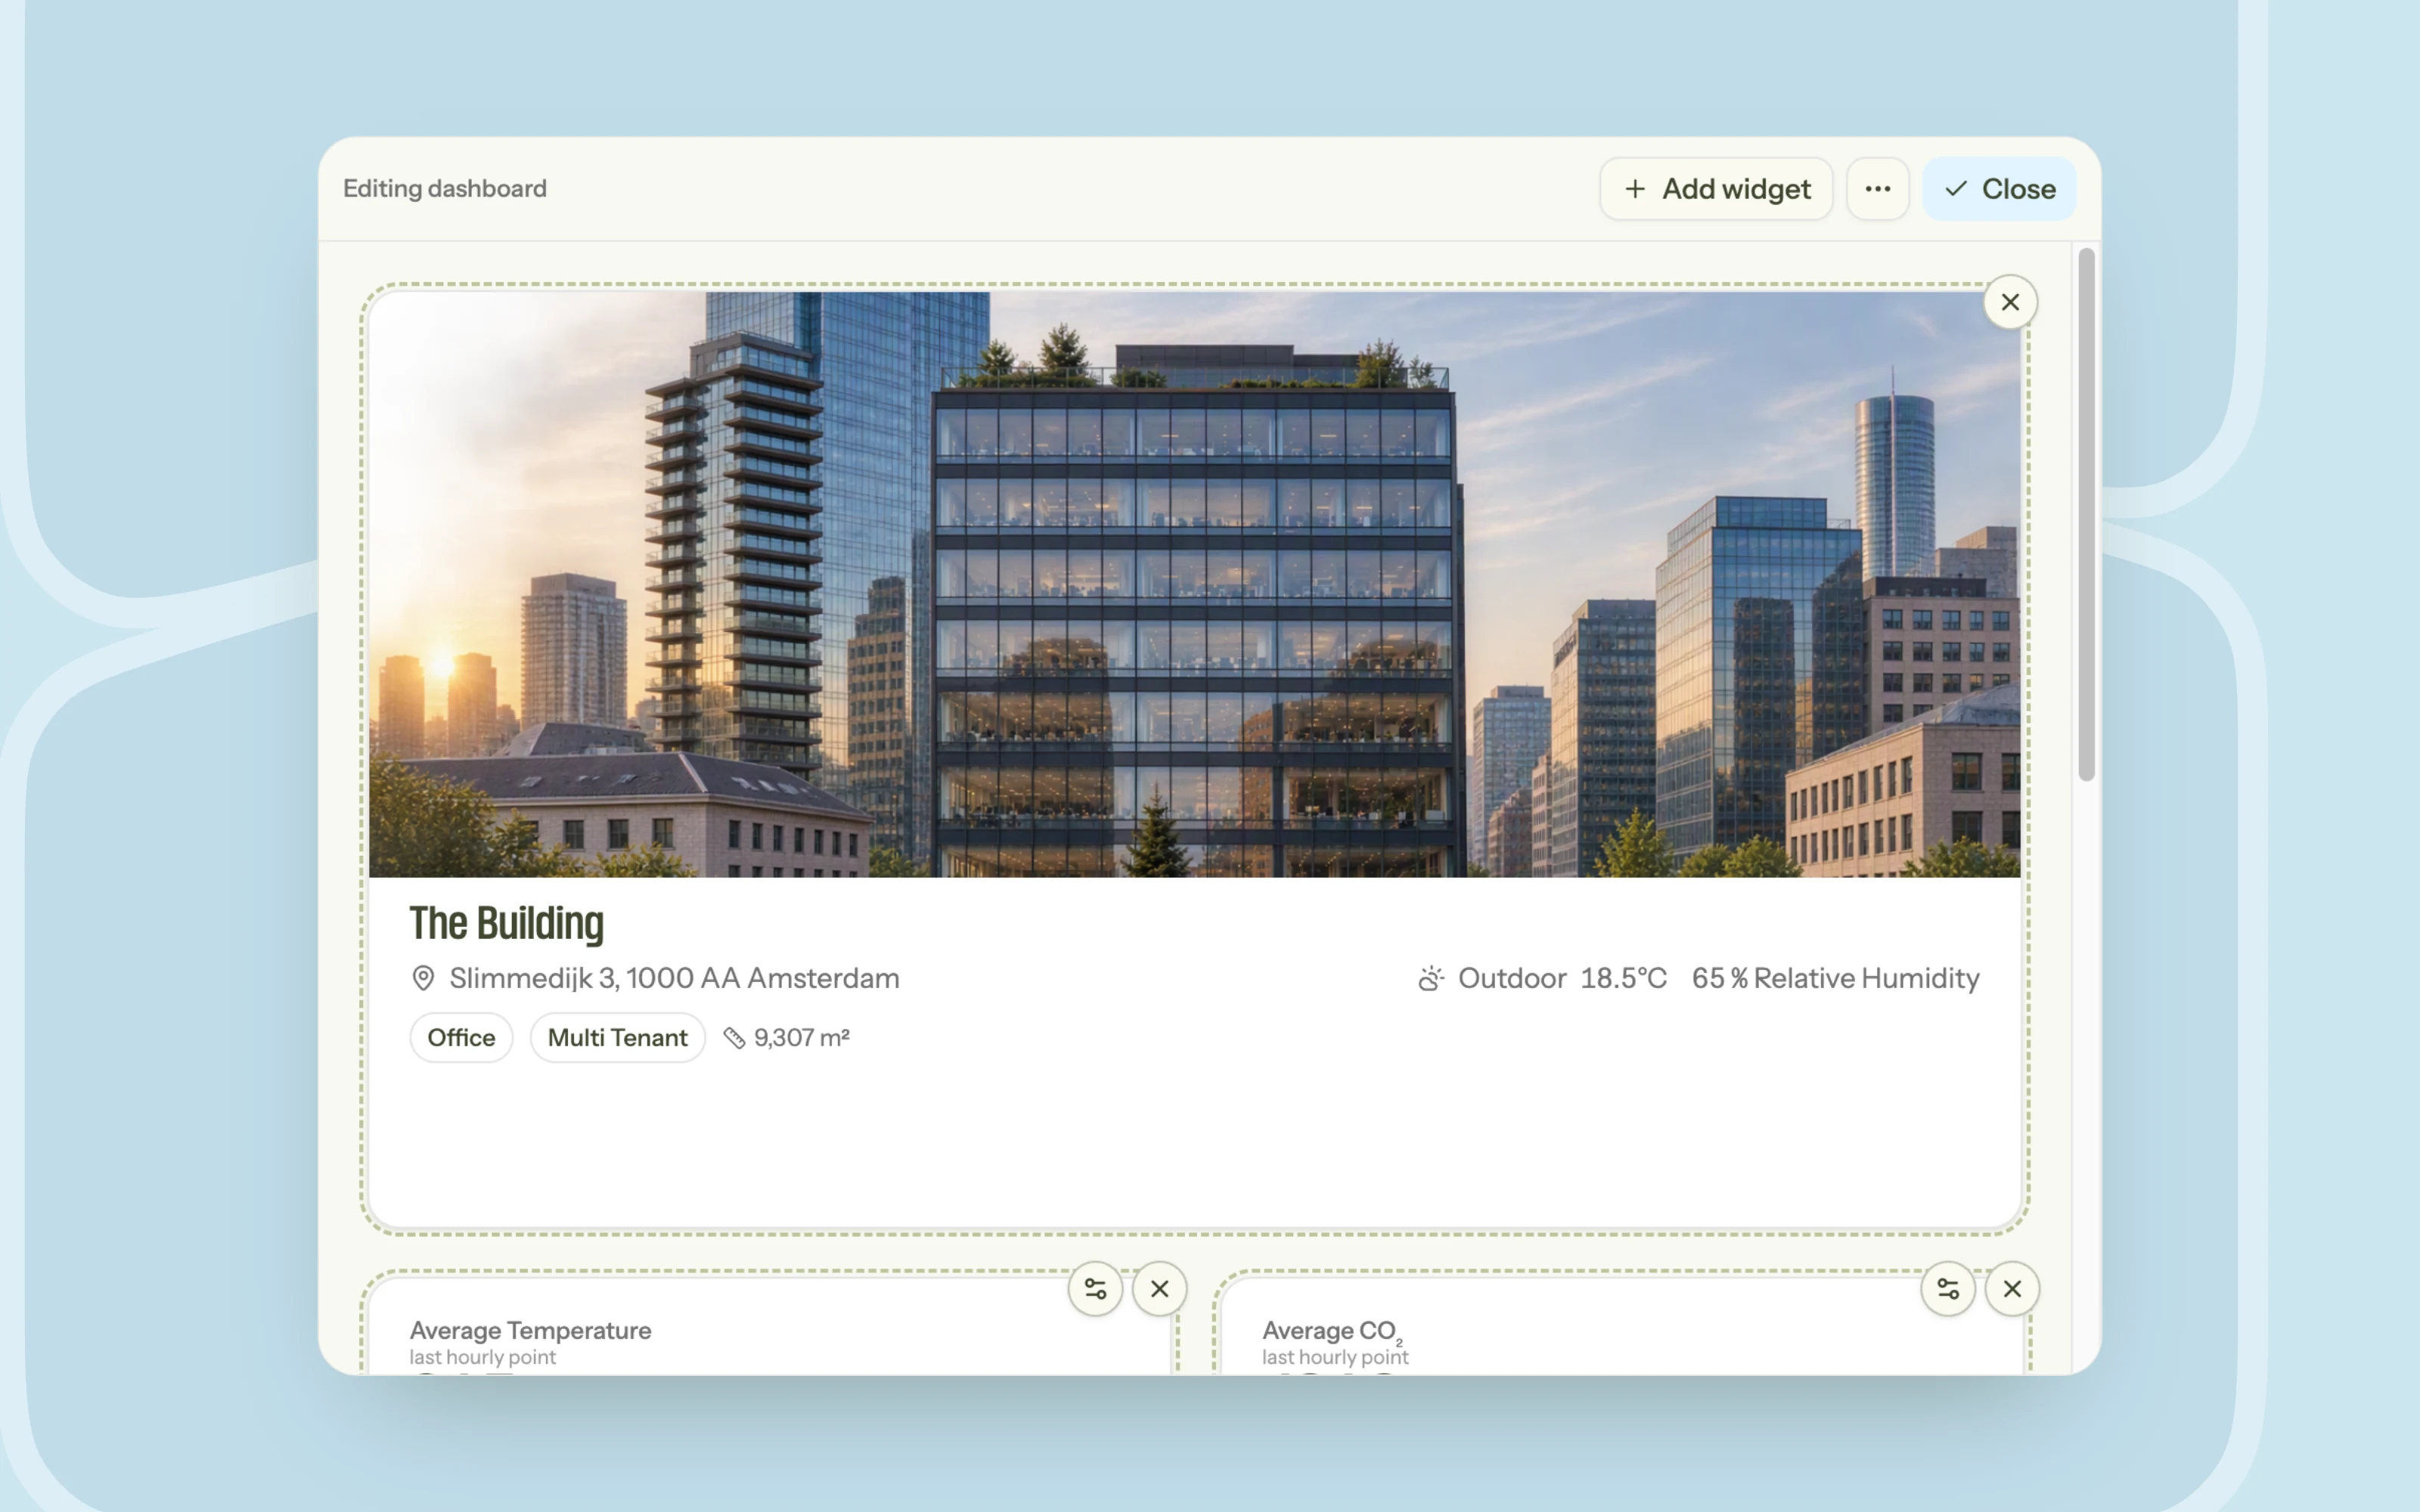
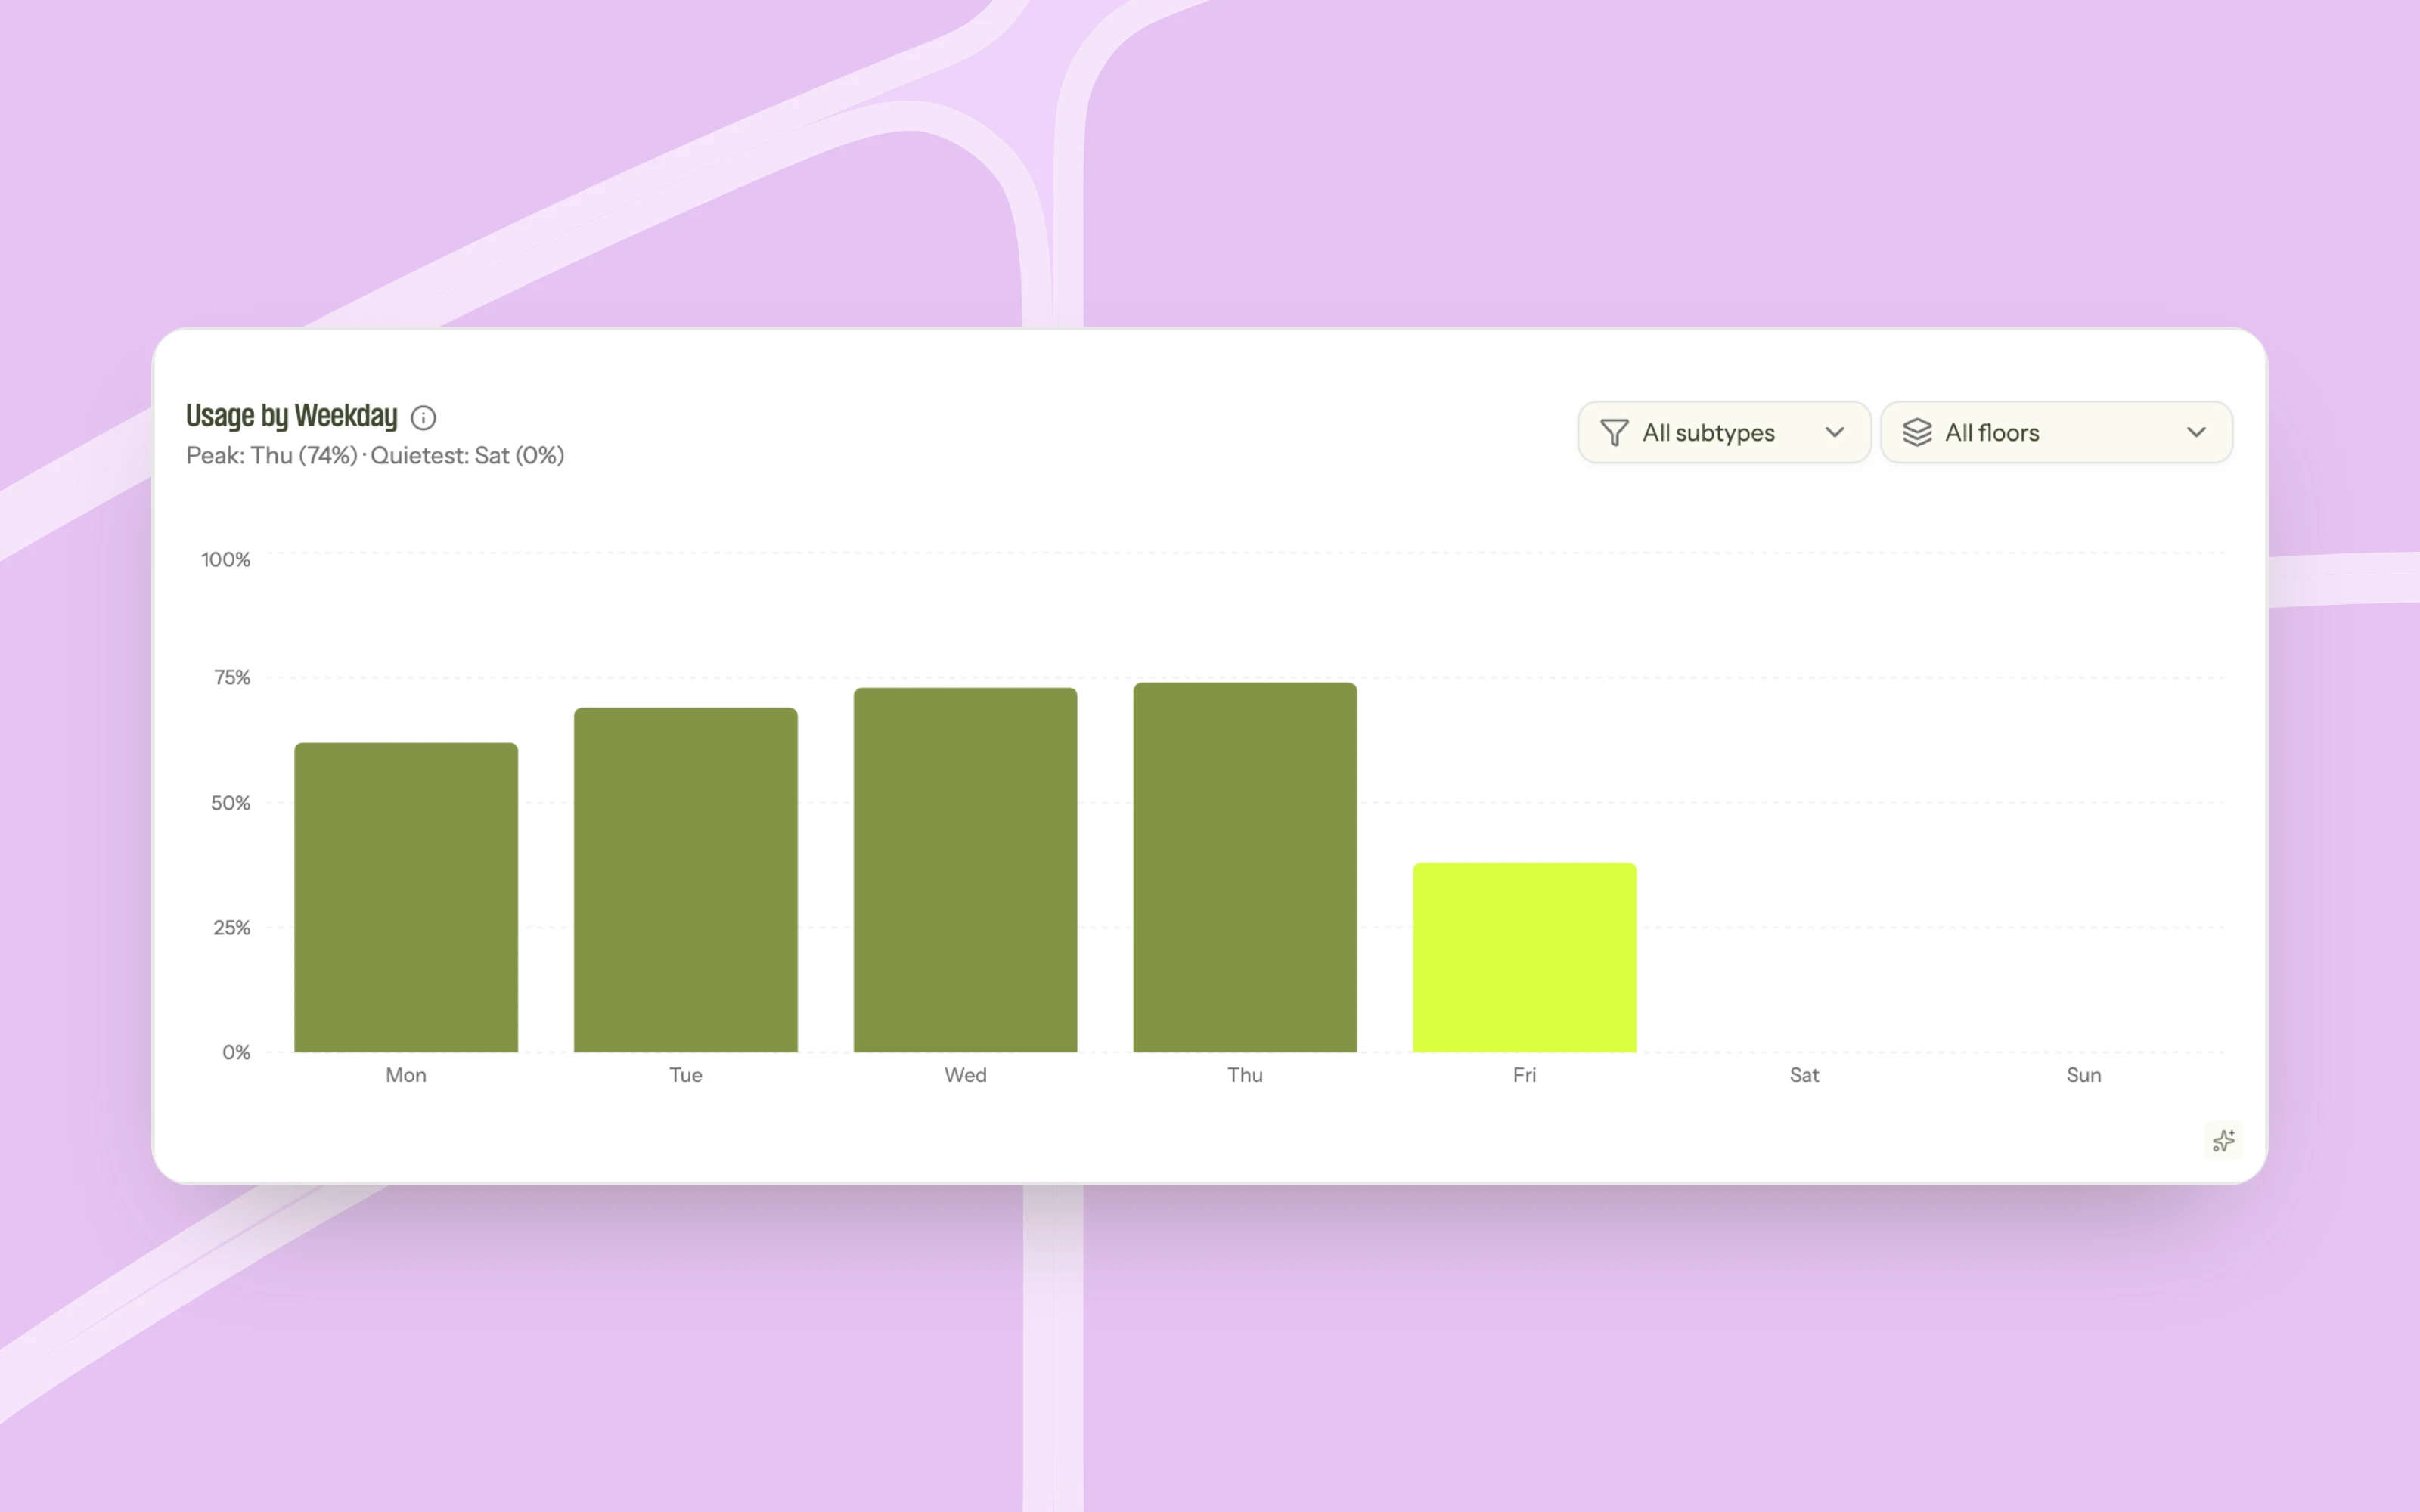
Each building starts with four dashboards: Overview, Energy, Comfort and Occupancy. Think of them as a starting point. You can arrange each dashboard so the numbers you look at most are at the top, and choose the time period for the whole page at once.
Energy
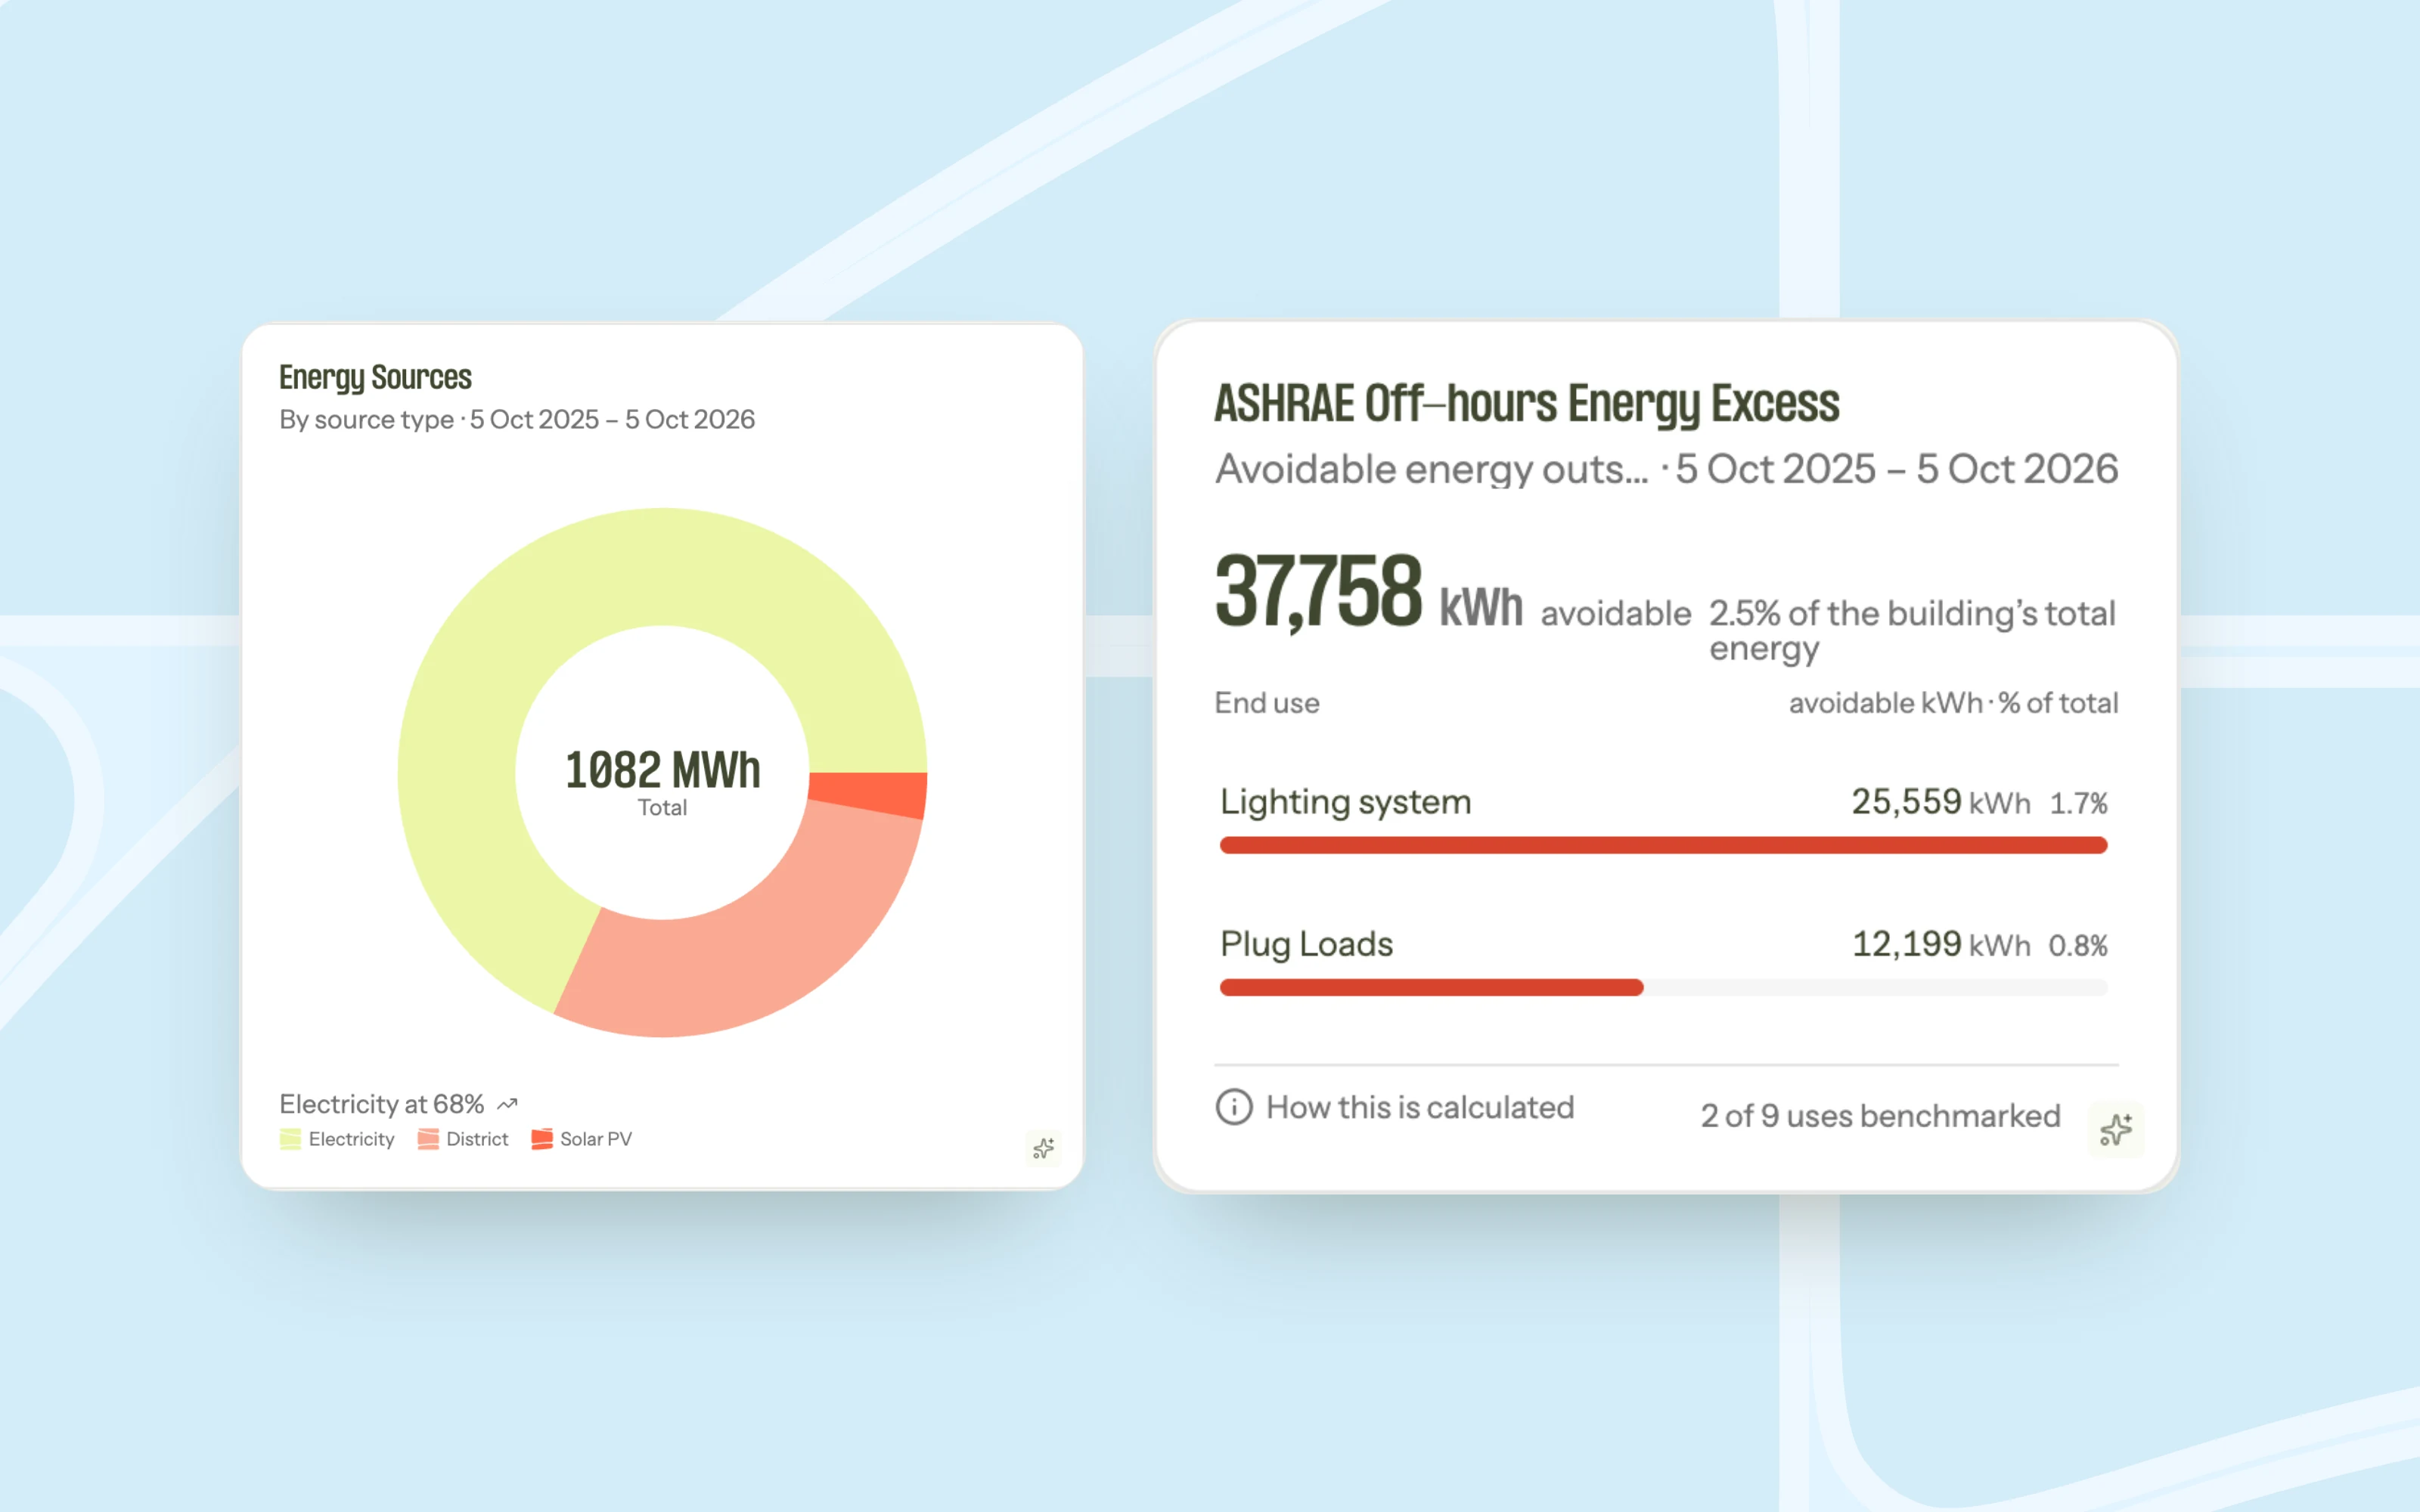
Energy shows how much a building uses, where that energy comes from and what it's used for, down to the hour. It also points out where energy is being wasted, so you know where to look first.
Comfort
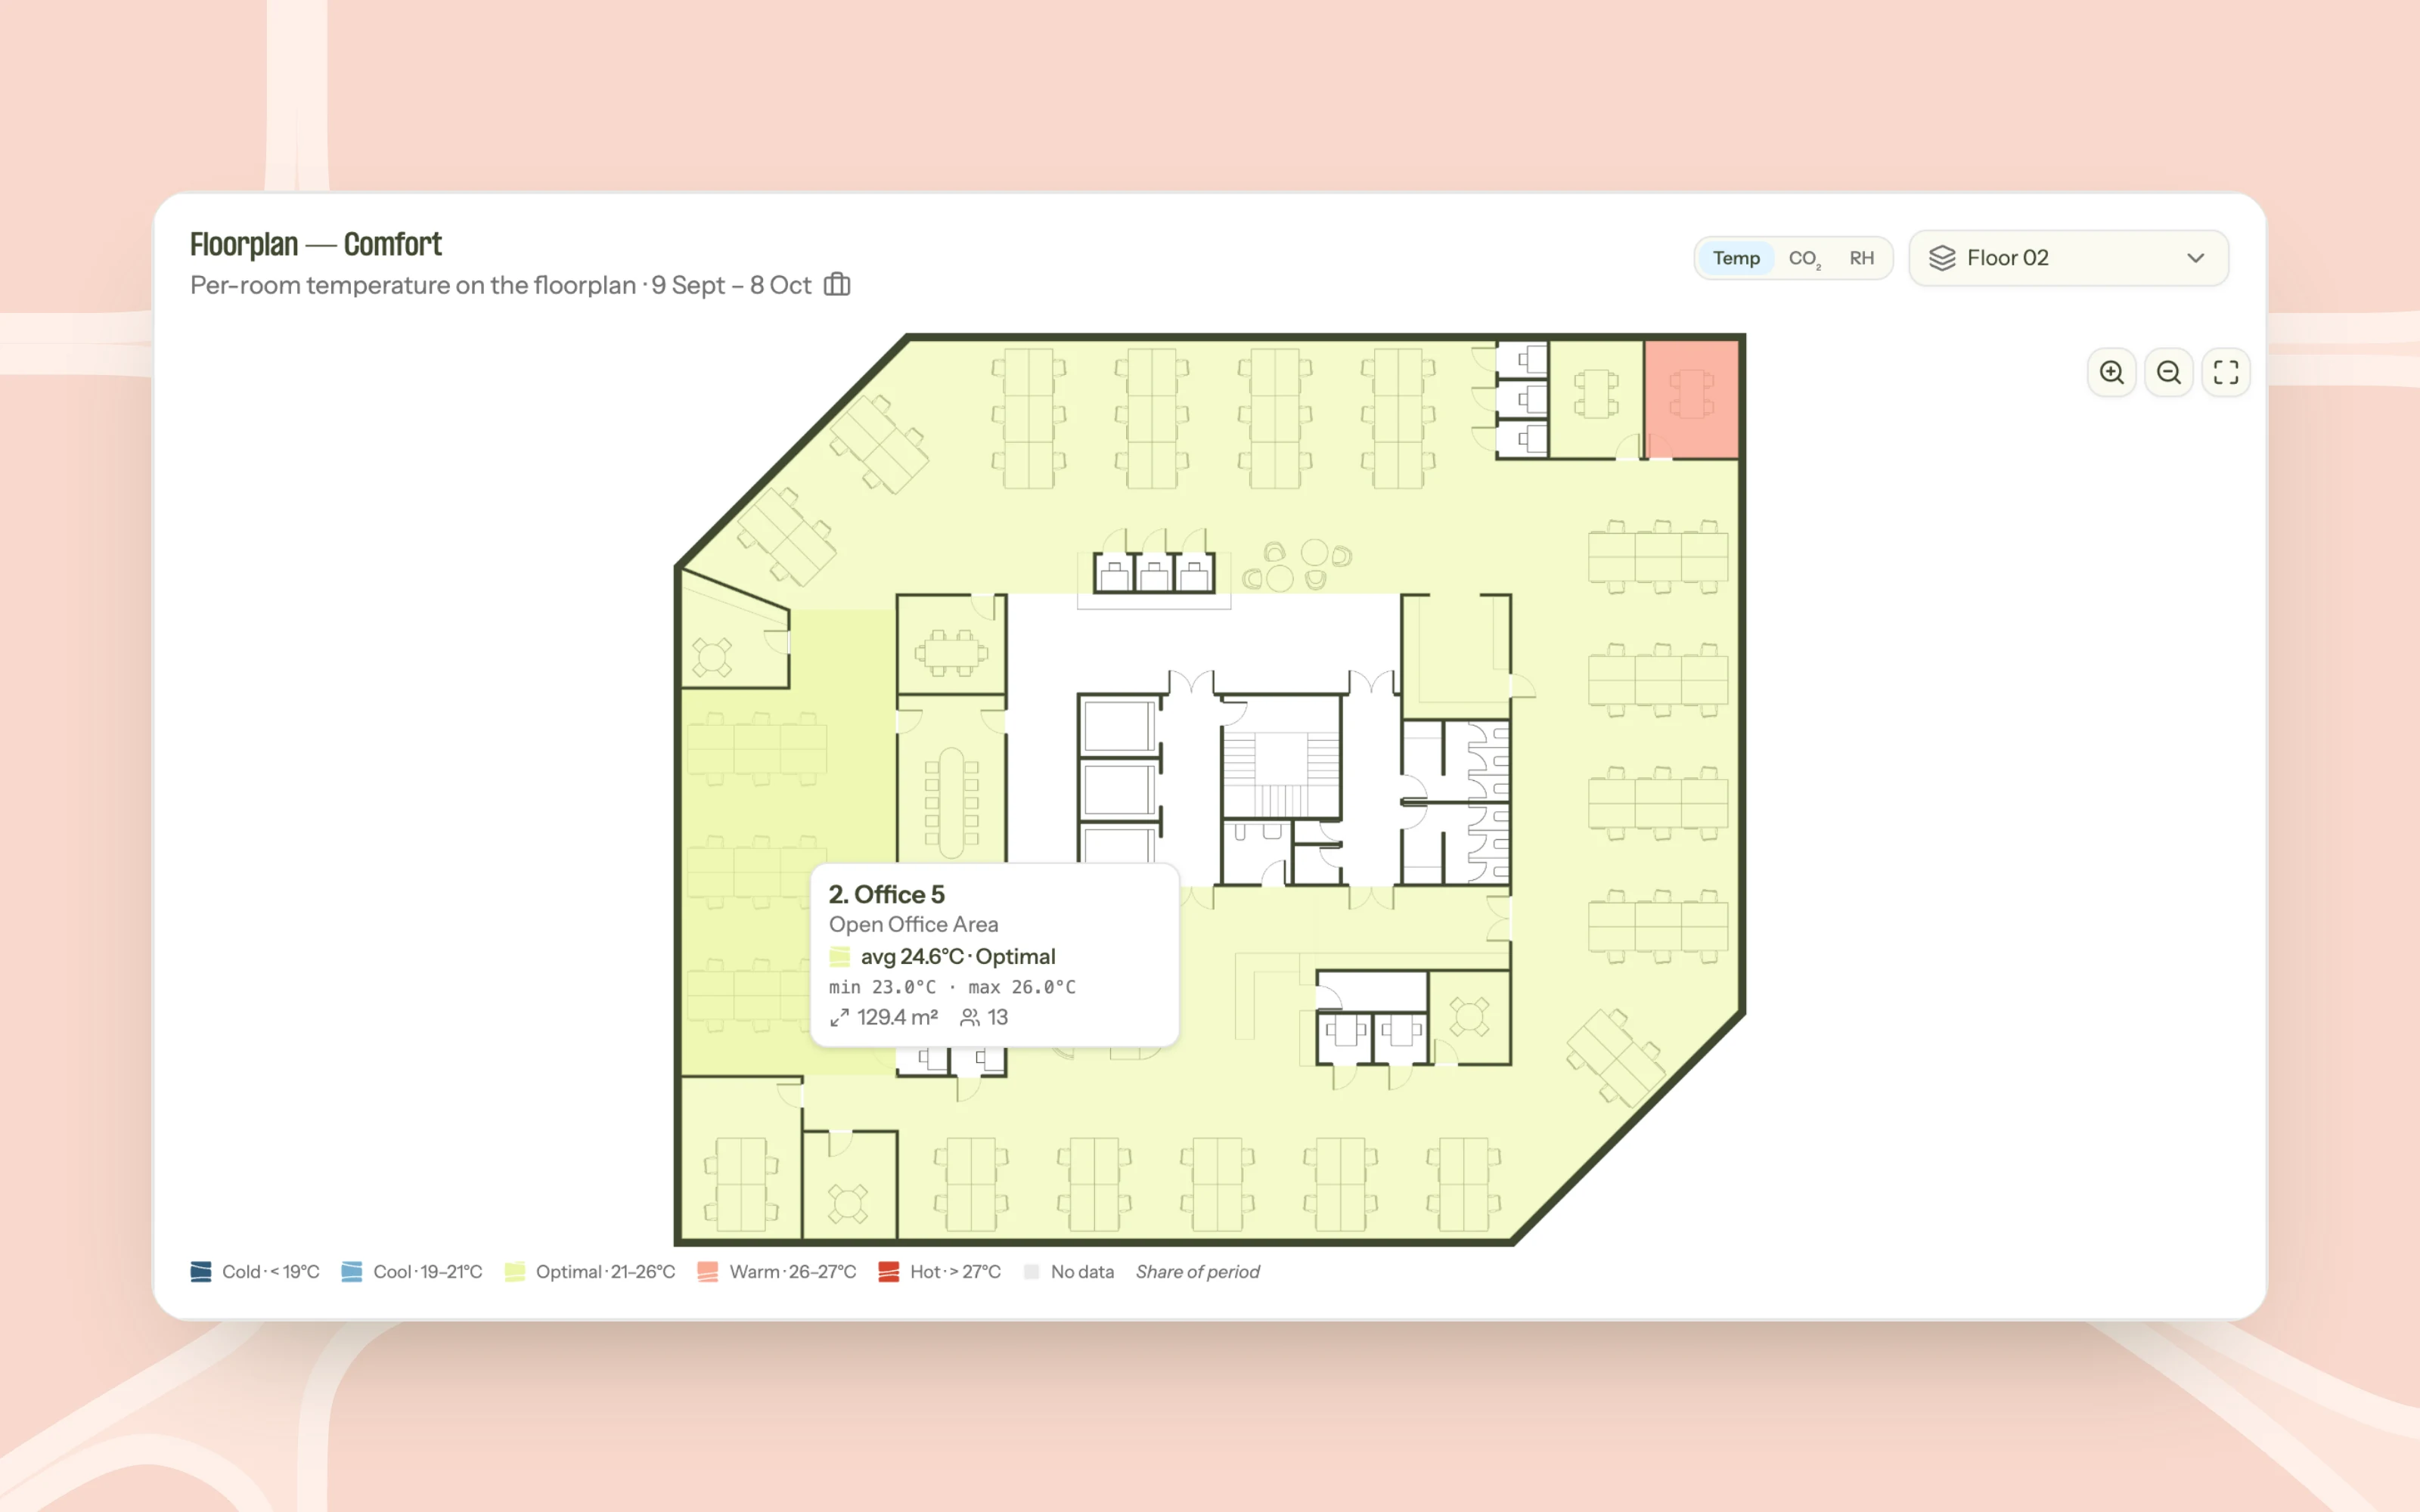
Comfort shows how temperature, CO₂ and humidity develop in every room, and how much of the time each room stays within a comfortable range. That way you can see where people are likely to feel too warm, too cold or short of fresh air.
Occupancy
Occupancy shows how the building's spaces are really used over time. With that picture, heating and ventilation can follow the way people use the building instead of a fixed schedule.
Asking the Building Agent
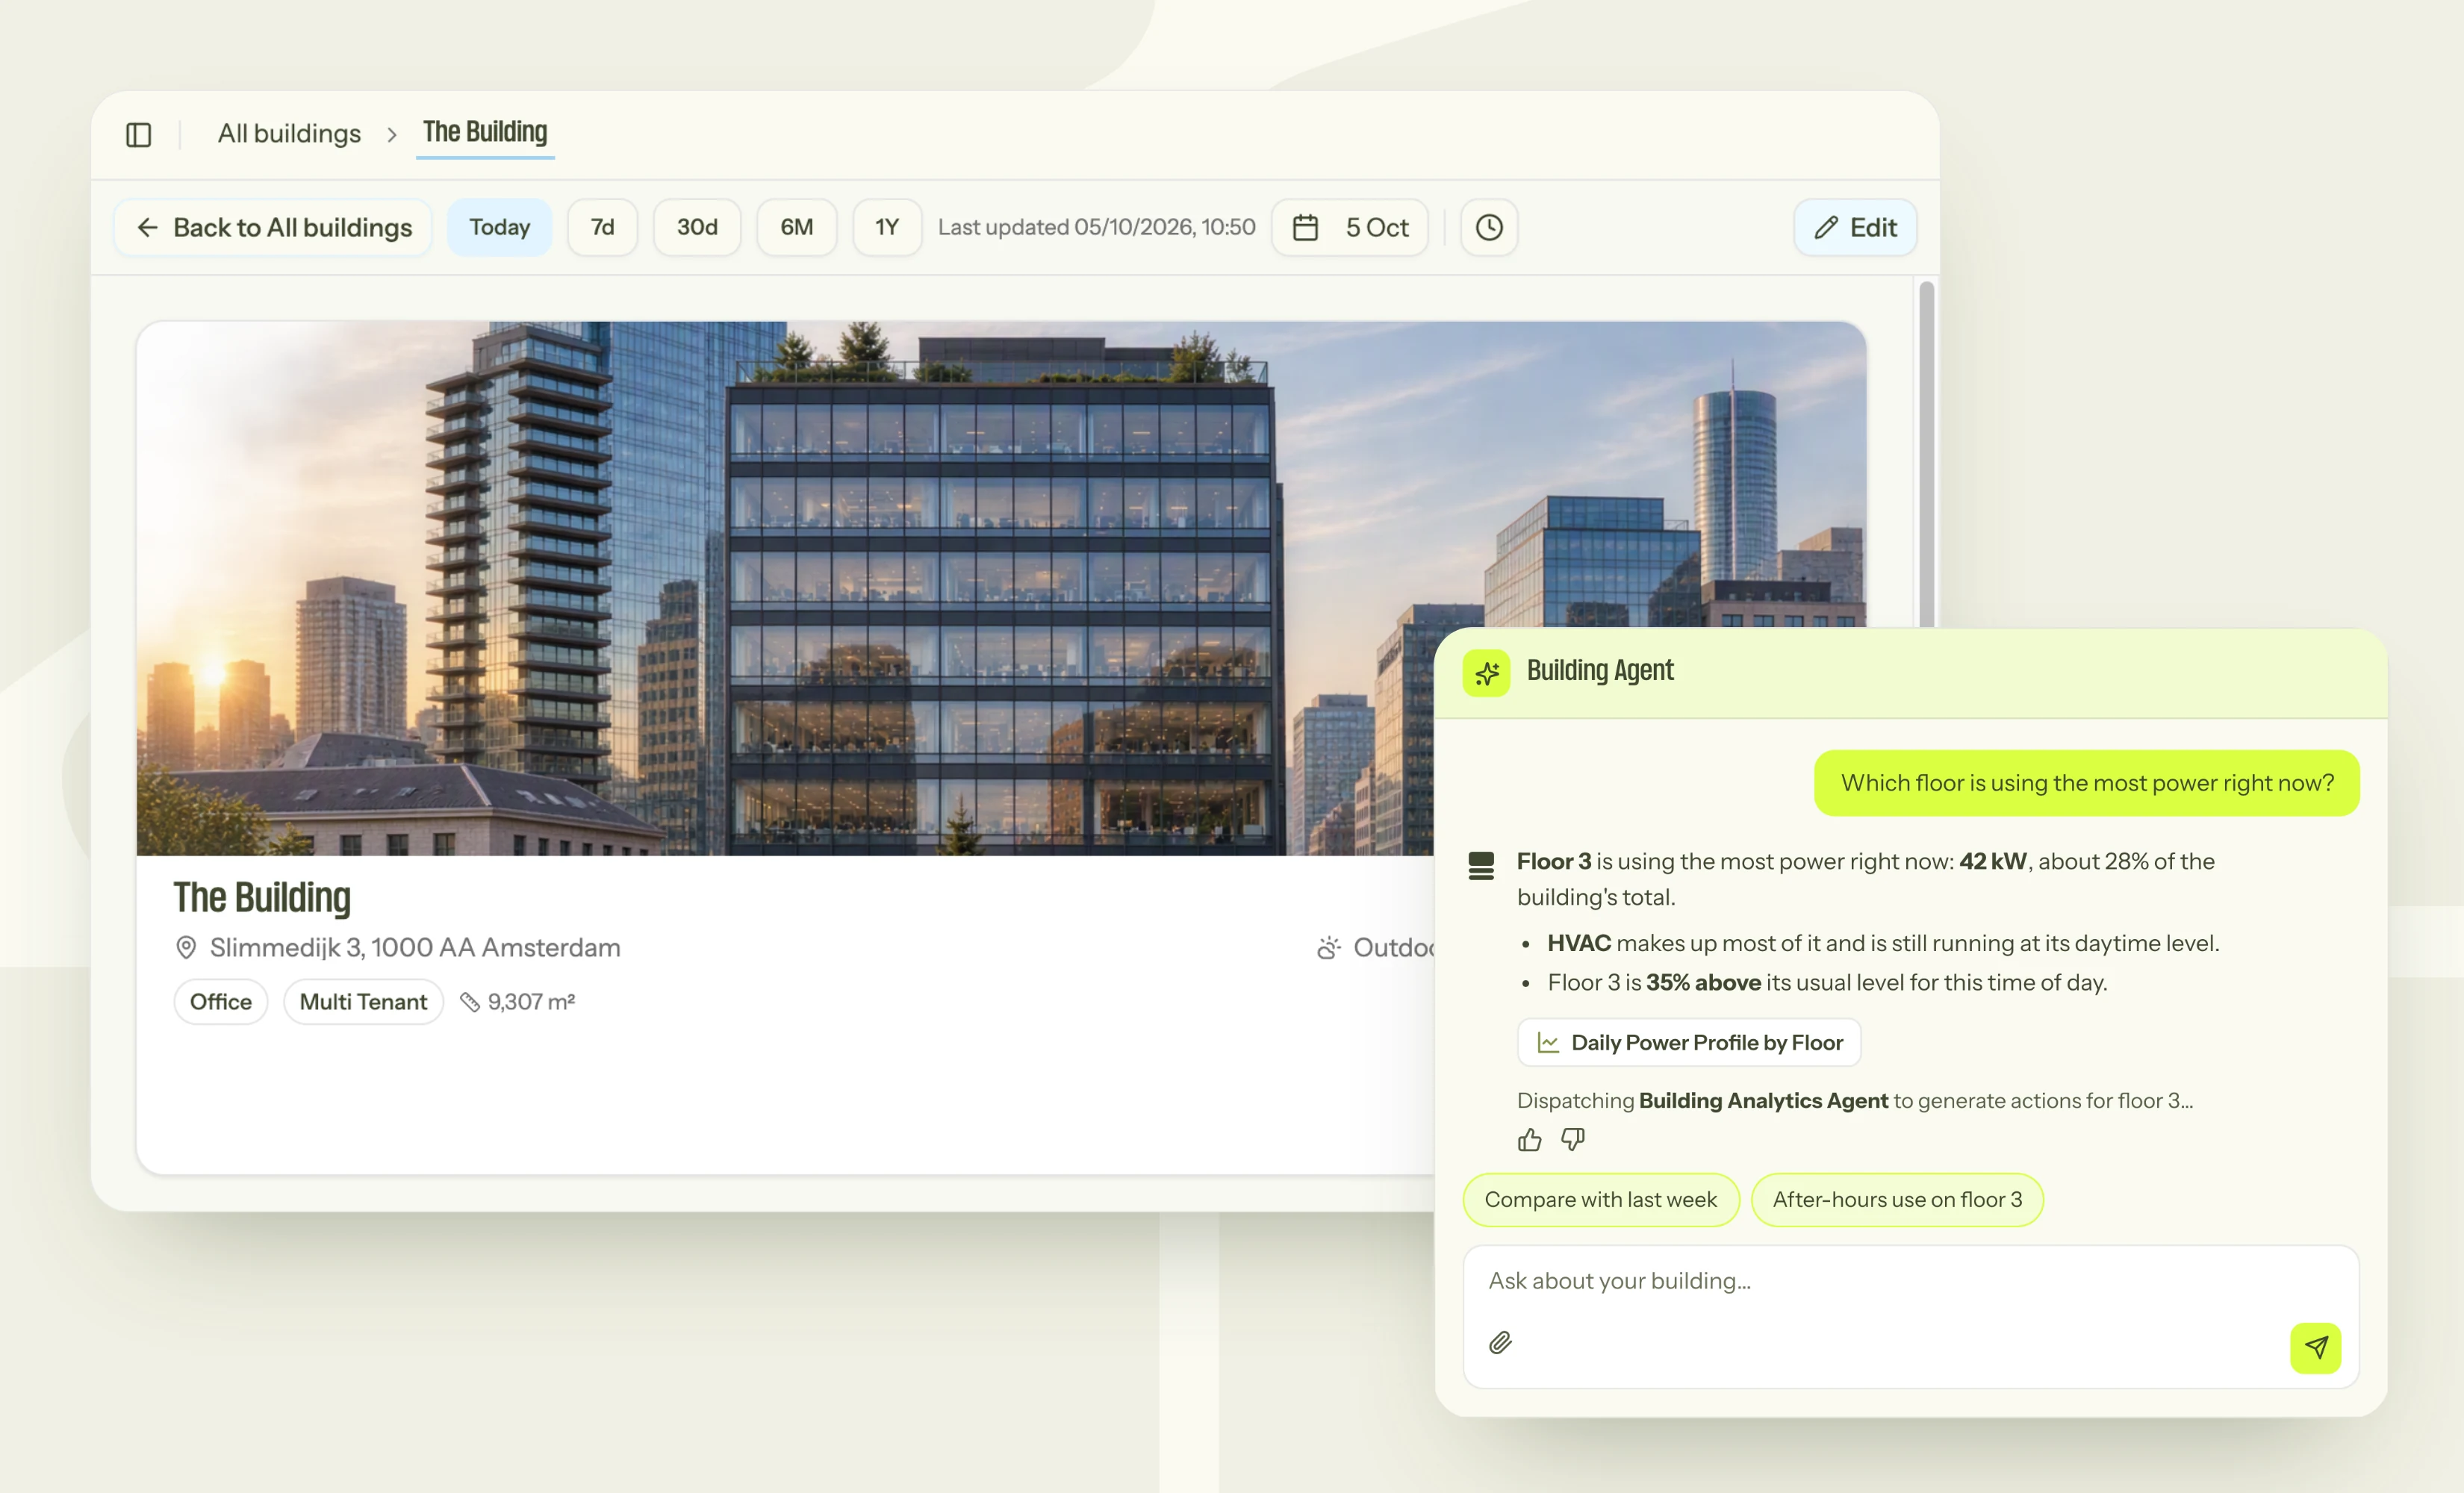
Dashboards are useful when you know where to look. When you don't, you can ask the Building Agent. It sits next to your dashboards and answers questions about your building in plain language, using the building's own data.
You could ask "Which floor is using the most power right now?" The Building Agent will name the floor, explain what's driving the use and compare it with a normal day. It also shows where its answer comes from, so you can check the data yourself, and suggests a follow-up question if you want to dig further.
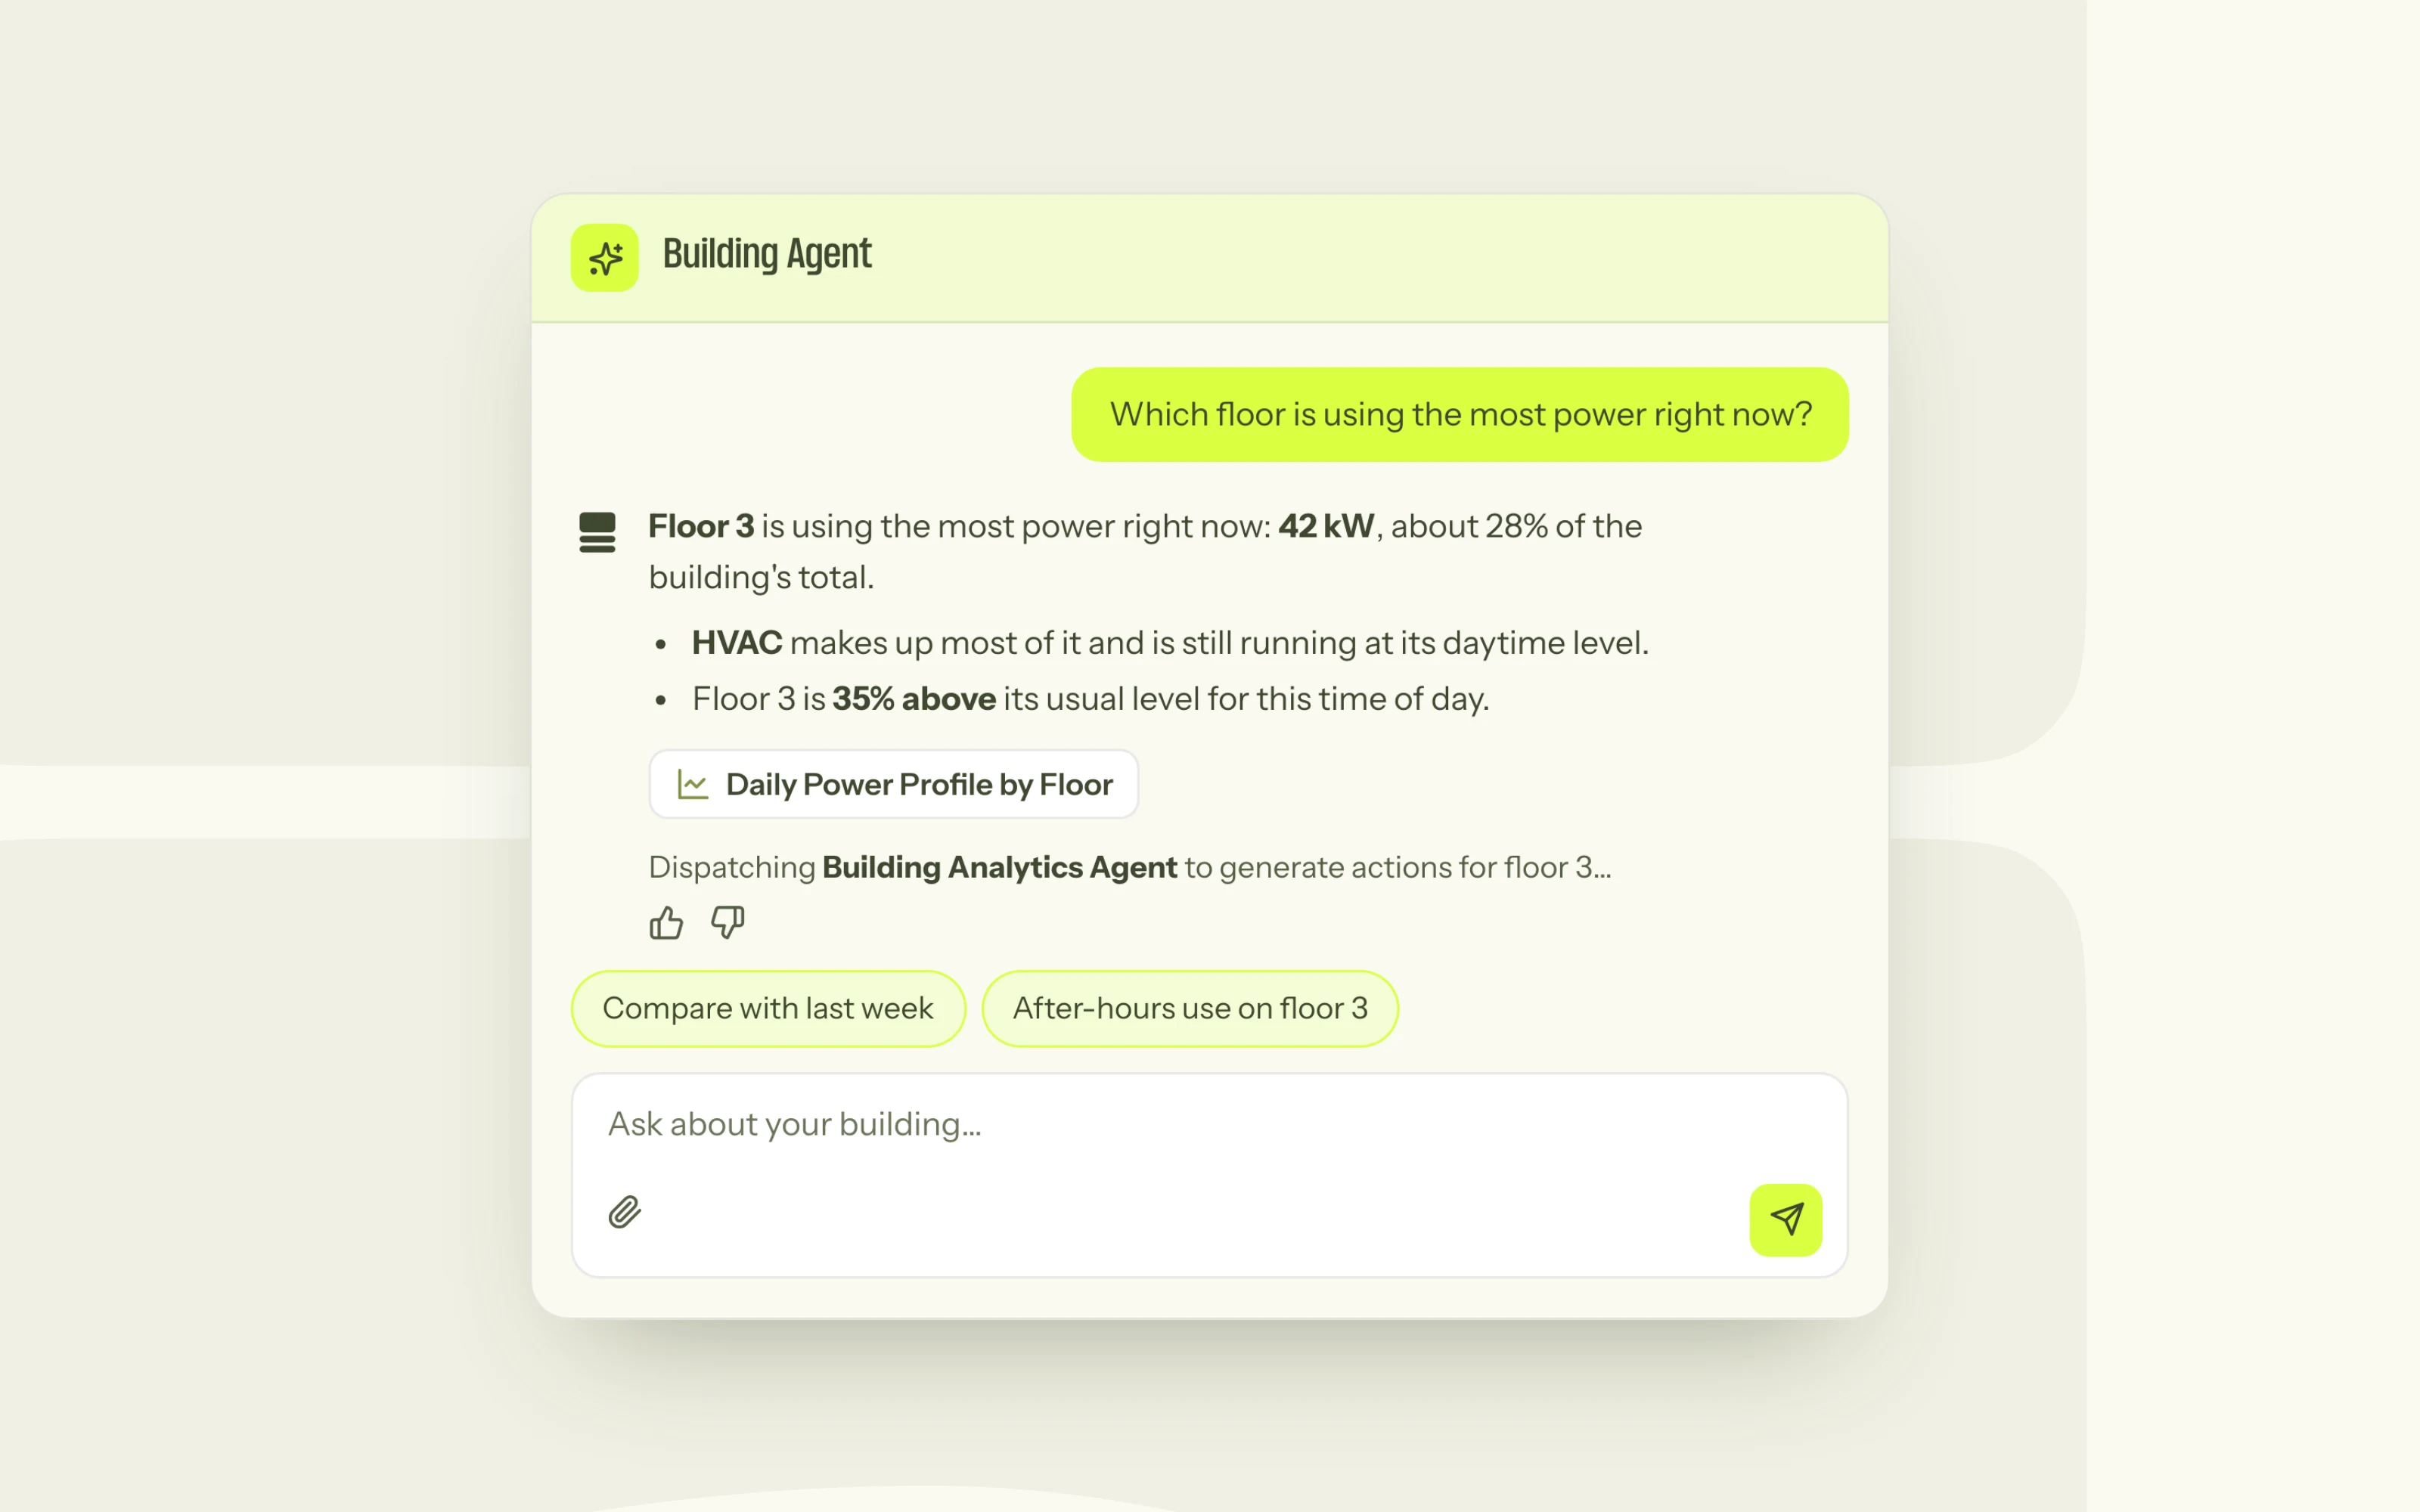
The Building Agent always knows which building and time period you're looking at, so you don't need to explain the context. You can also attach a document, like an energy audit, and ask questions about it straight away.
From finding to verified saving
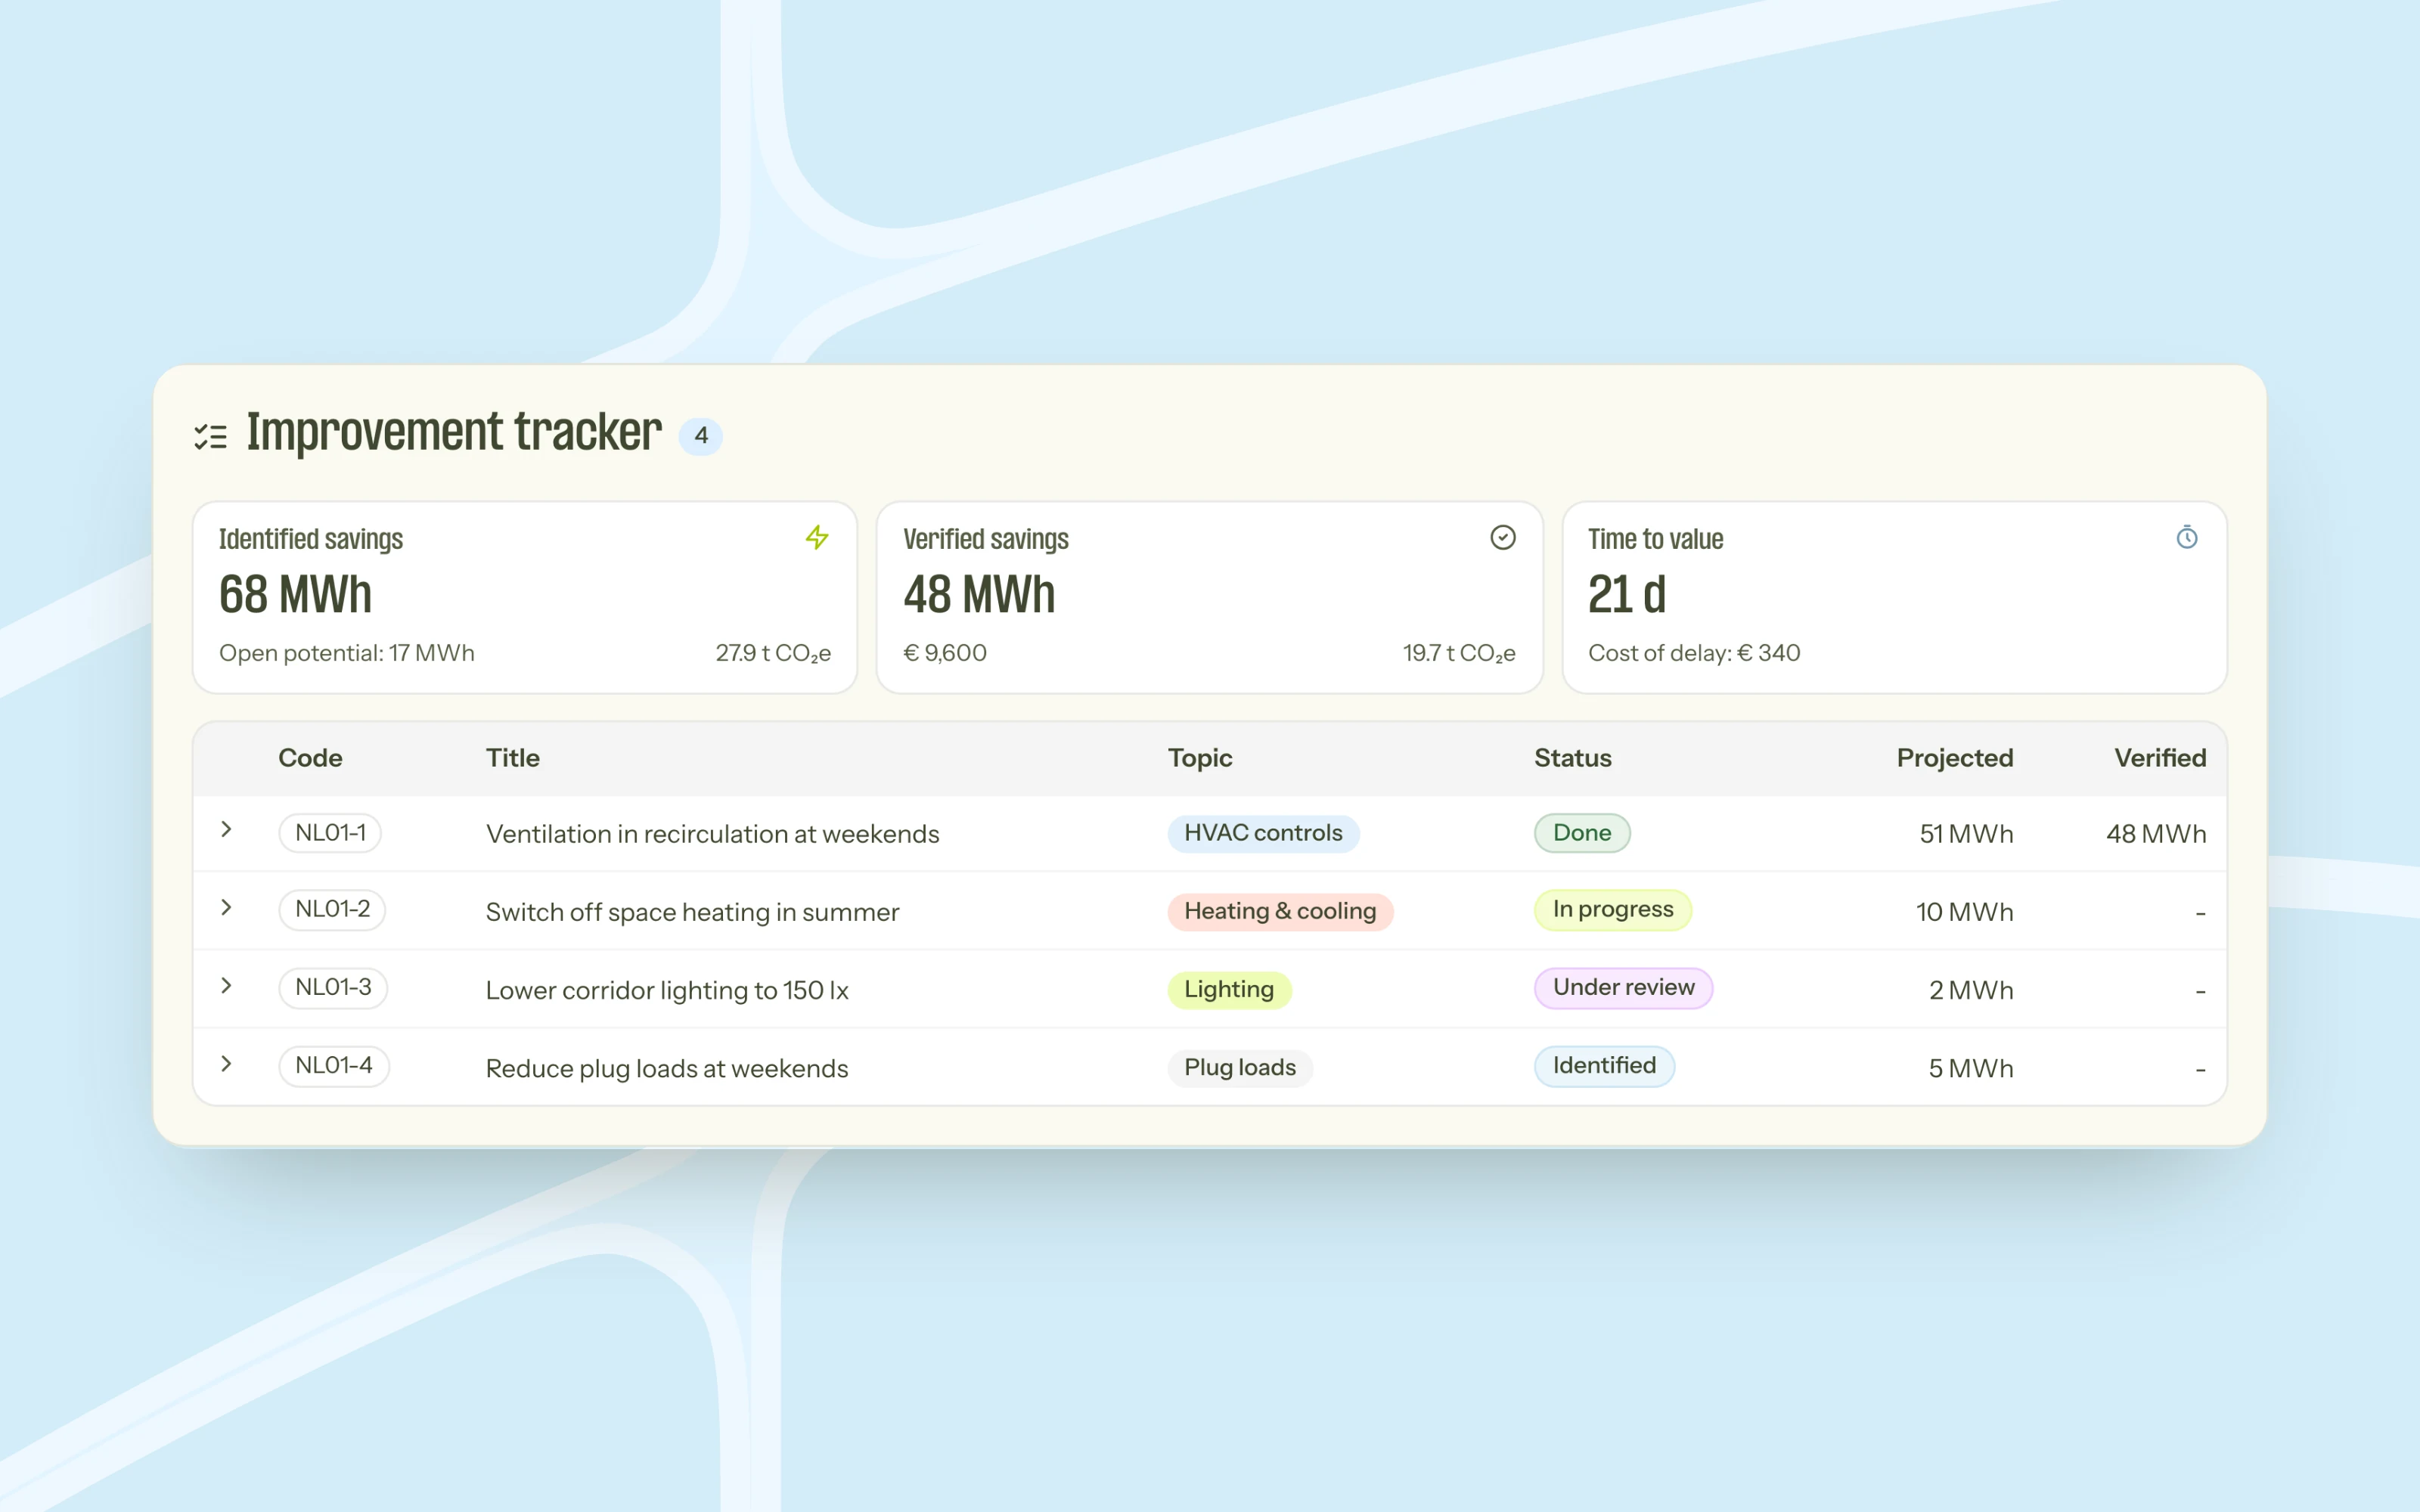
Finding a problem is only useful if something happens next. That's what the Improvement tracker is for.
Our AI agents analyse each building's data continuously. When they find a way to save energy, a Next Sense Building Performance Expert checks it first. Once it's confirmed, it's added to the tracker with a description of the issue, a recommended action and the savings it's expected to bring. Your Building Performance Expert then agrees the next steps with your team.
After the change is made, we check whether it actually worked. This step is called measurement and verification, or M&V. We compare the building's energy use before and after the change using real meter data. Only then does the improvement move to Done, and its projected savings are replaced by verified savings.
Seeing where a building stands
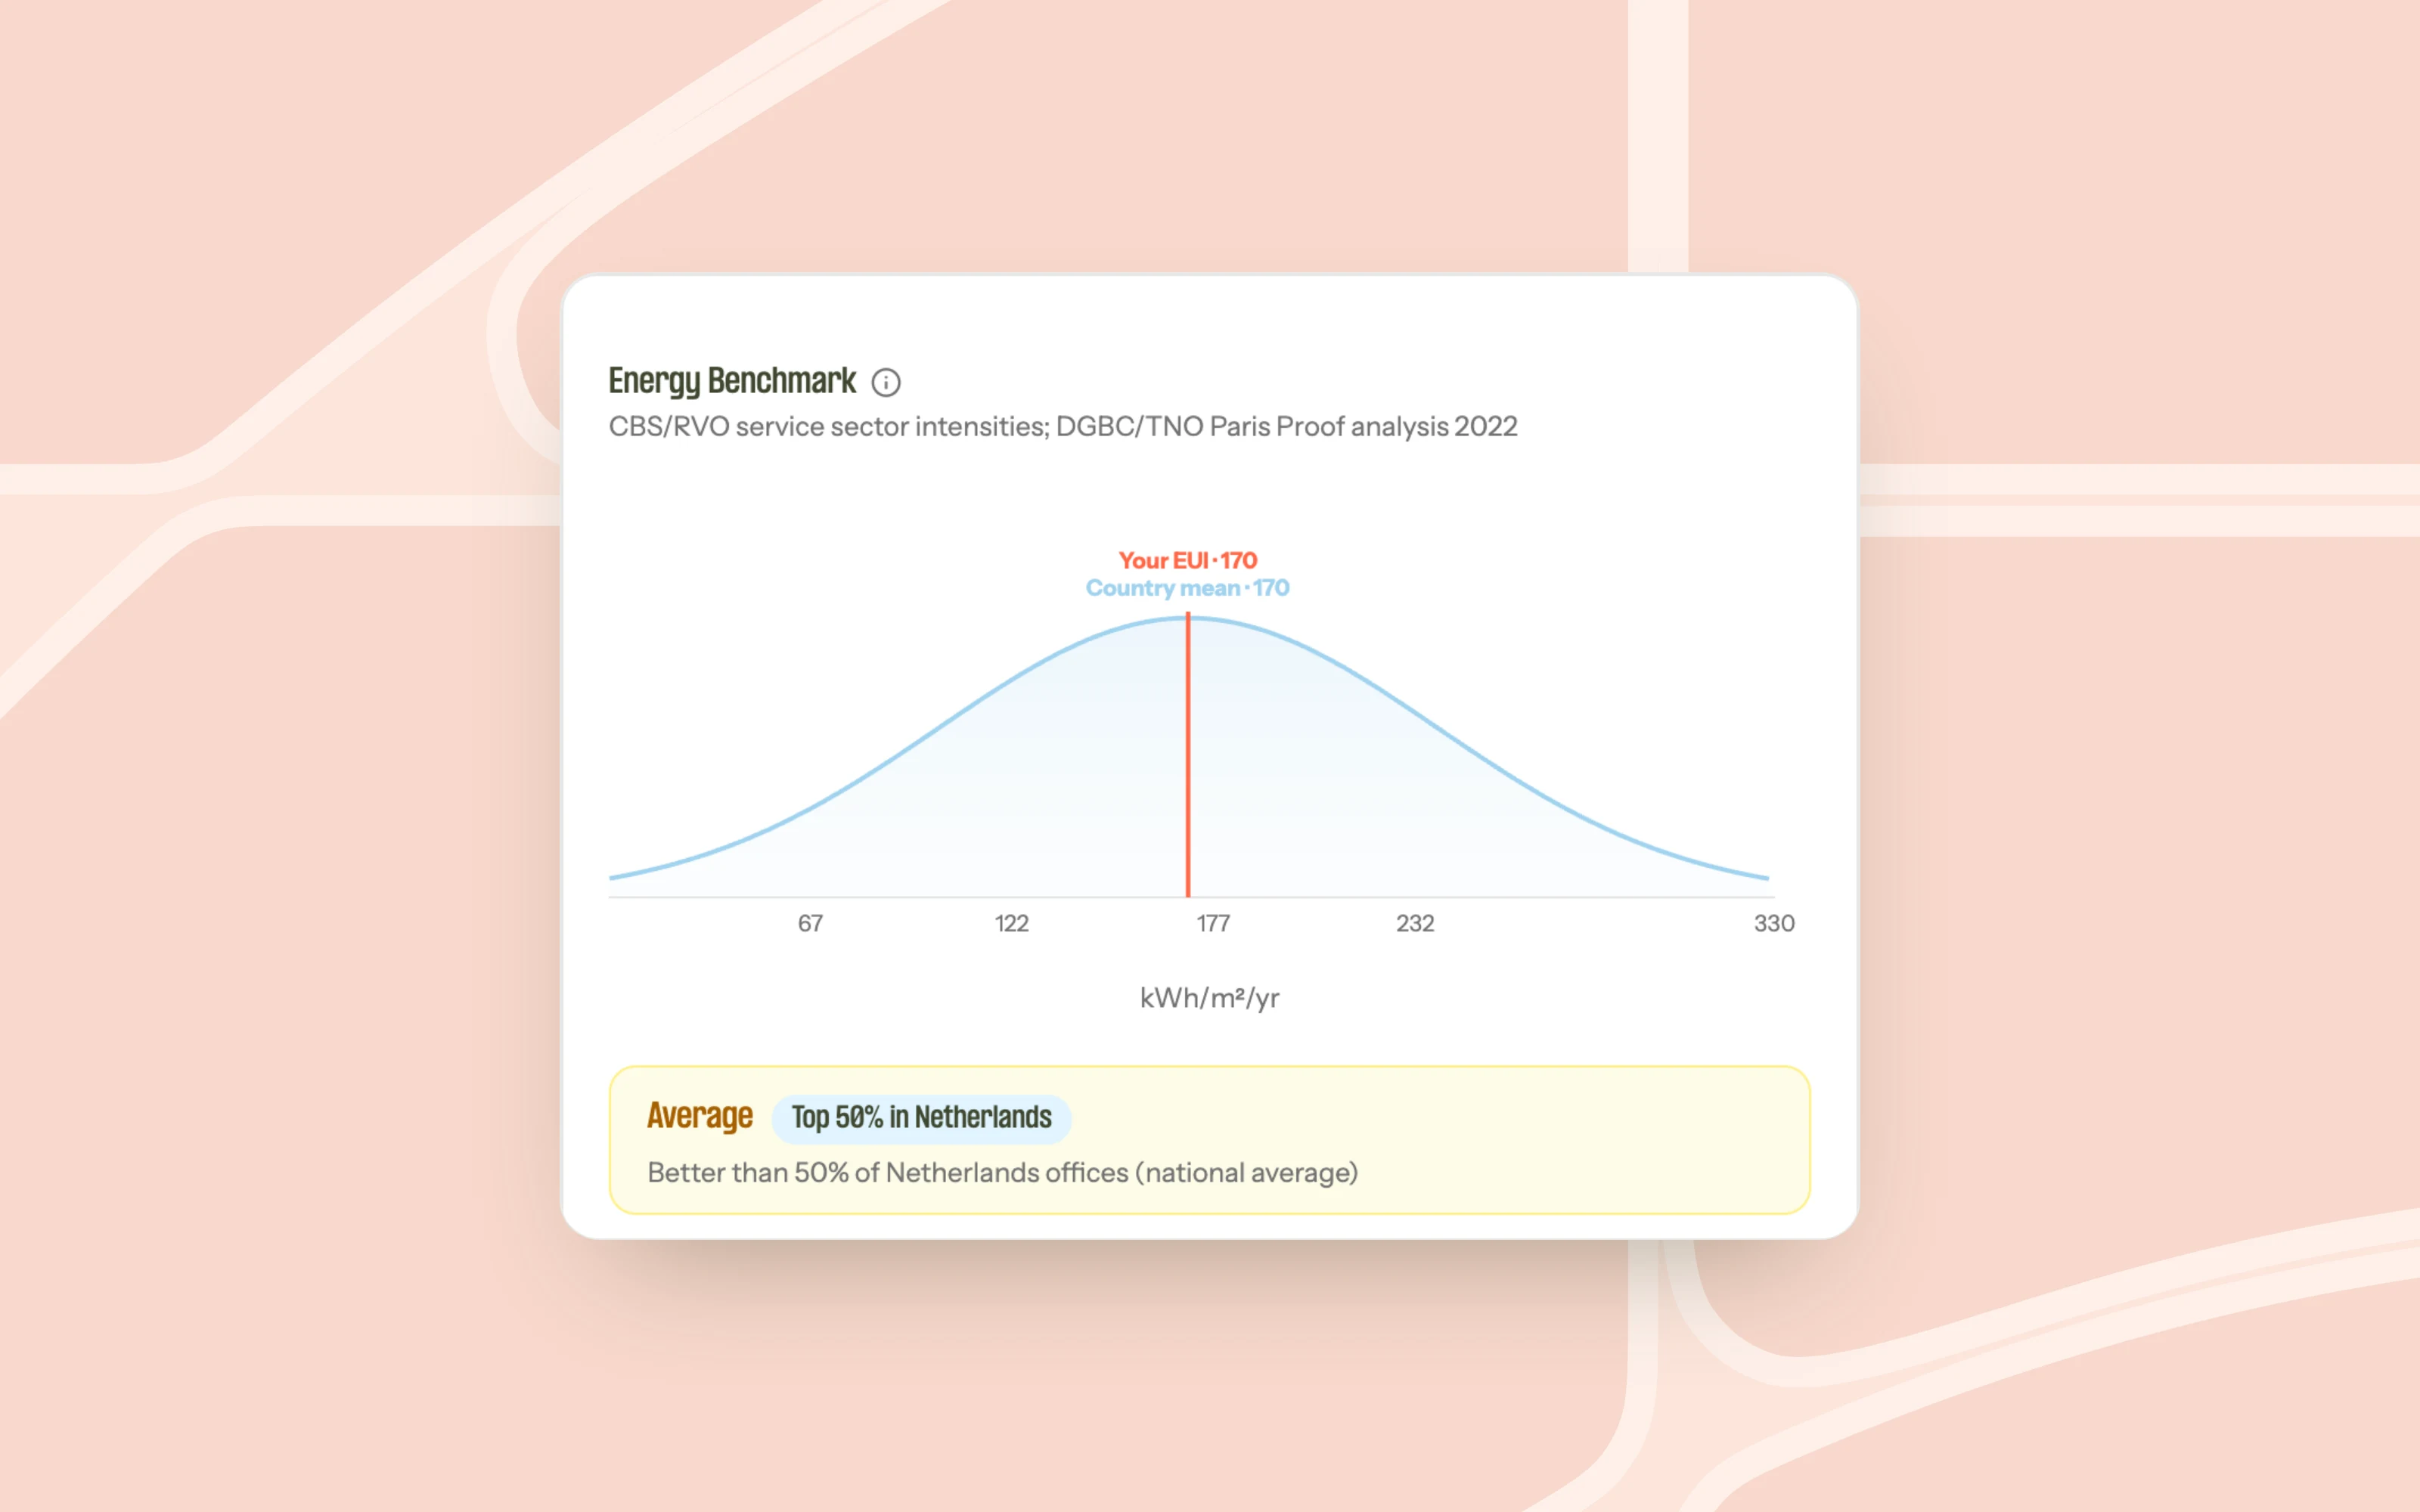
The BIC also shows how each building compares with similar buildings and with the standards and regulations that matter, such as Paris Proof and CRREM. That way you can see which buildings are on track and which are at risk, and plan improvements and investments in good time.
What we're working on next
Right now, the Building Agent answers when you ask it something. The next step is autonomous agents. The Building Agent will lead a team of specialist agents that run their own analyses and let you know when they find a problem, without you having to ask.
We're also working on fault detection and diagnostics (FDD), which will spot faults in installations such as HVAC and point to the likely cause. And tenant split will break energy use down per tenant, which makes it easier to share energy costs fairly in buildings with several tenants. We'll write more about each of these when they're ready.
Want to see it for yourself?
If you'd like to see what the BIC shows for your own buildings, book a demo and we'll walk you through it.